Digital Economy and Society Index
1.data
This data was a MakeOverMonday event data, and I got it from data.world. However data itself was published by European Union (EU) and they still keep publishing it. If you want to work on this data, you can either go to data.world and download it, or you can directly go to related publication page on EU’s statistics and information website and search for “Digital Economy and Society Index” for newer versions.
2.story
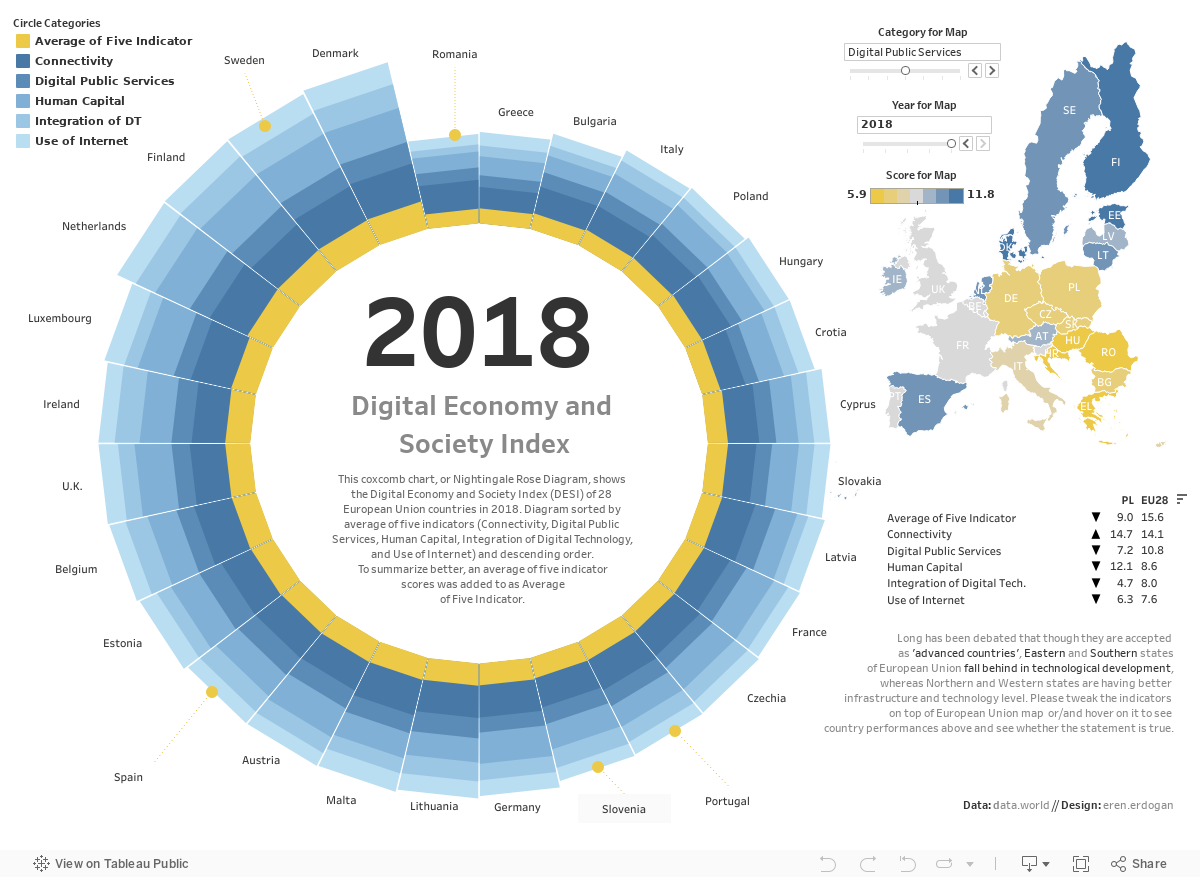
In last decade, there was a huge transition into digital society, yet not every country has the same pace to jump into it. For that, European Union came up with an index to assess whether a country is doing good or not. Digital Economy and Society Index, or shortly DESI, have provided better insights on this transition and emphasized the gap between some countries.
3.tips
The Nightingale Chart in the heart of this dashboard is one of the challenging dashboards that I’ve crated so far. Though it looks cool and self-explanatory, this chart lacks short processing time and needs a lot of processor power. I don’t suggest this chart unless there are some stackable data, and there is a visible difference between the shares, –honestly, when you check the score differences in the chart, close competitors have almost no difference, yet it’s visible between leading ones and the lasts-, because this chart shines when there is a real difference between items. It should be noted that this chart may have some tooltips problem due to processing process and for that, I had to add a small data table and filtered it interactively by the map. Too see some Action tricks to filter charts and get info about The Nightingale Chart (aka Coxcomb Chart), please click the link.